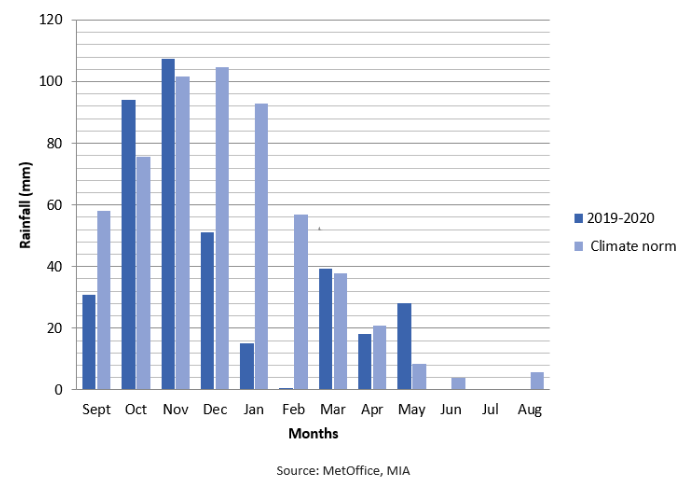
Local records of rainfall are organised on a 12-month period, starting from September 1st of every year and running up till August 31st of the following year. The average rainfall measured at Luqa airport for the 1981-2020 climatic baseline is 567mm. This thirty-year period shows that December & November register the highest precipitation amounts, with July receiving almost none.
Data collected by the Meteorological Office at the MIA shows that the total rainfall registered last year at Luqa during 2019-2020 was 384.4mm. This is equivalent to 32% less than the climate norm. The wettest month during the year 2019-2020 was November, with 107.4mm. The exceptionally dry winter is linked to relatively dry conditions affecting the Mediterranean region during late autumn and early winter, as Dr Charles Galdies from the Institute of Earth Systems, explains below. December of 2019 was also significantly drier than the climate norm, which registered 51.2mm of rainfall. This is less than half the expected climatological precipitation for the month. Drier December months have been the norm since 2014.
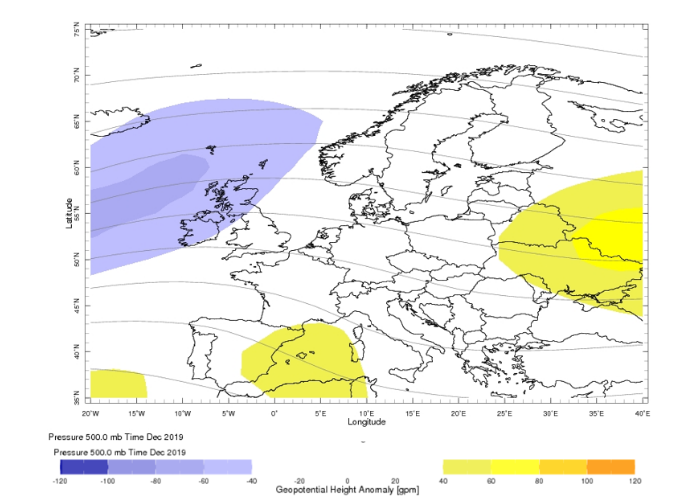
The map below shows the average geo-potential height climatology (1981-2010 base period) and anomalies at the 500 hPa pressure level in the atmosphere for December 2019. Monthly geo-potential height climatology values are shown as grey contours with a contour interval of 60 geo-potential meters (gpm). The positive anomaly observed over the Mediterranean region, especially over the western basin, leads to warmer atmospheric conditions further eastwards. Higher positive anomalies of the geo-potential height signify a much lower probability of the occurrence of weather instability and precipitation.