Phase II: Image Maps
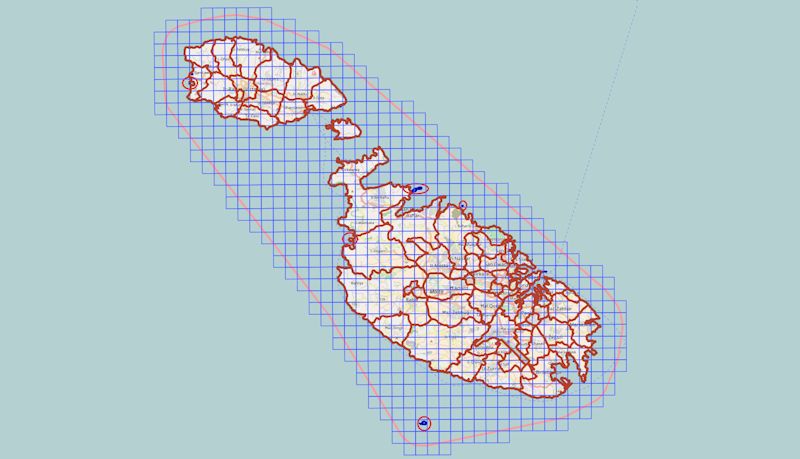
Phase II entailed the conversion of raw LAS data into a manageable set of aggregated spatial constructs based on Localites (NUTS5), a 1 Km Sq Grid covering the terrestrial and Marine zones and a High-Value area map.
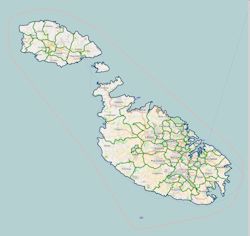
The Image Map was created as part of a process to generate a static form of map depiction.
Tools: Lastools, Potree 2, QGIS
Local Counboundaries.
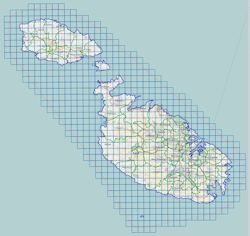
Grid Mapetric LiDAsq. cells.
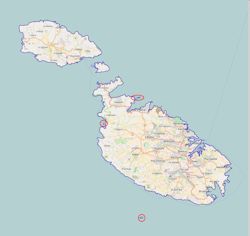
Wrecks, Cultural Zones.
Phase III: Interactive Maps
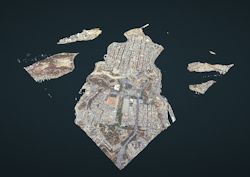
Interactive Zonal LiDAR Maps - Phase III entailed the conversion of raw LAS data into a manageable set of aggregated spatial constructs based on National, Islands (NUTS 3), Regional (NUTS4 Districts and Regjuni), Localites (NUTS5) and a 1 Km Sq Grid covering the terrestrial and Marine zones.
The Zonal Boundaries depict the aggregated areas
Tools: Lastools, Potree, QGIS
Interactive Map